“A common use of standard deviations is to periodically inspect the data set for a metric and alert if it has significantly varied from the mean. For instance, we may set an alert for when the number of unauthorized login attempts per day is three standard deviations greater than the mean. Provided that this data set has Gaussian distribution, we would expect that only 0.3% of the data points would trigger the alert. Even this simple type of statistical analysis is valuable because no one had to define a static threshold value, something which is infeasible if we are tracking thousands or hundreds of thousands of production metrics.†”
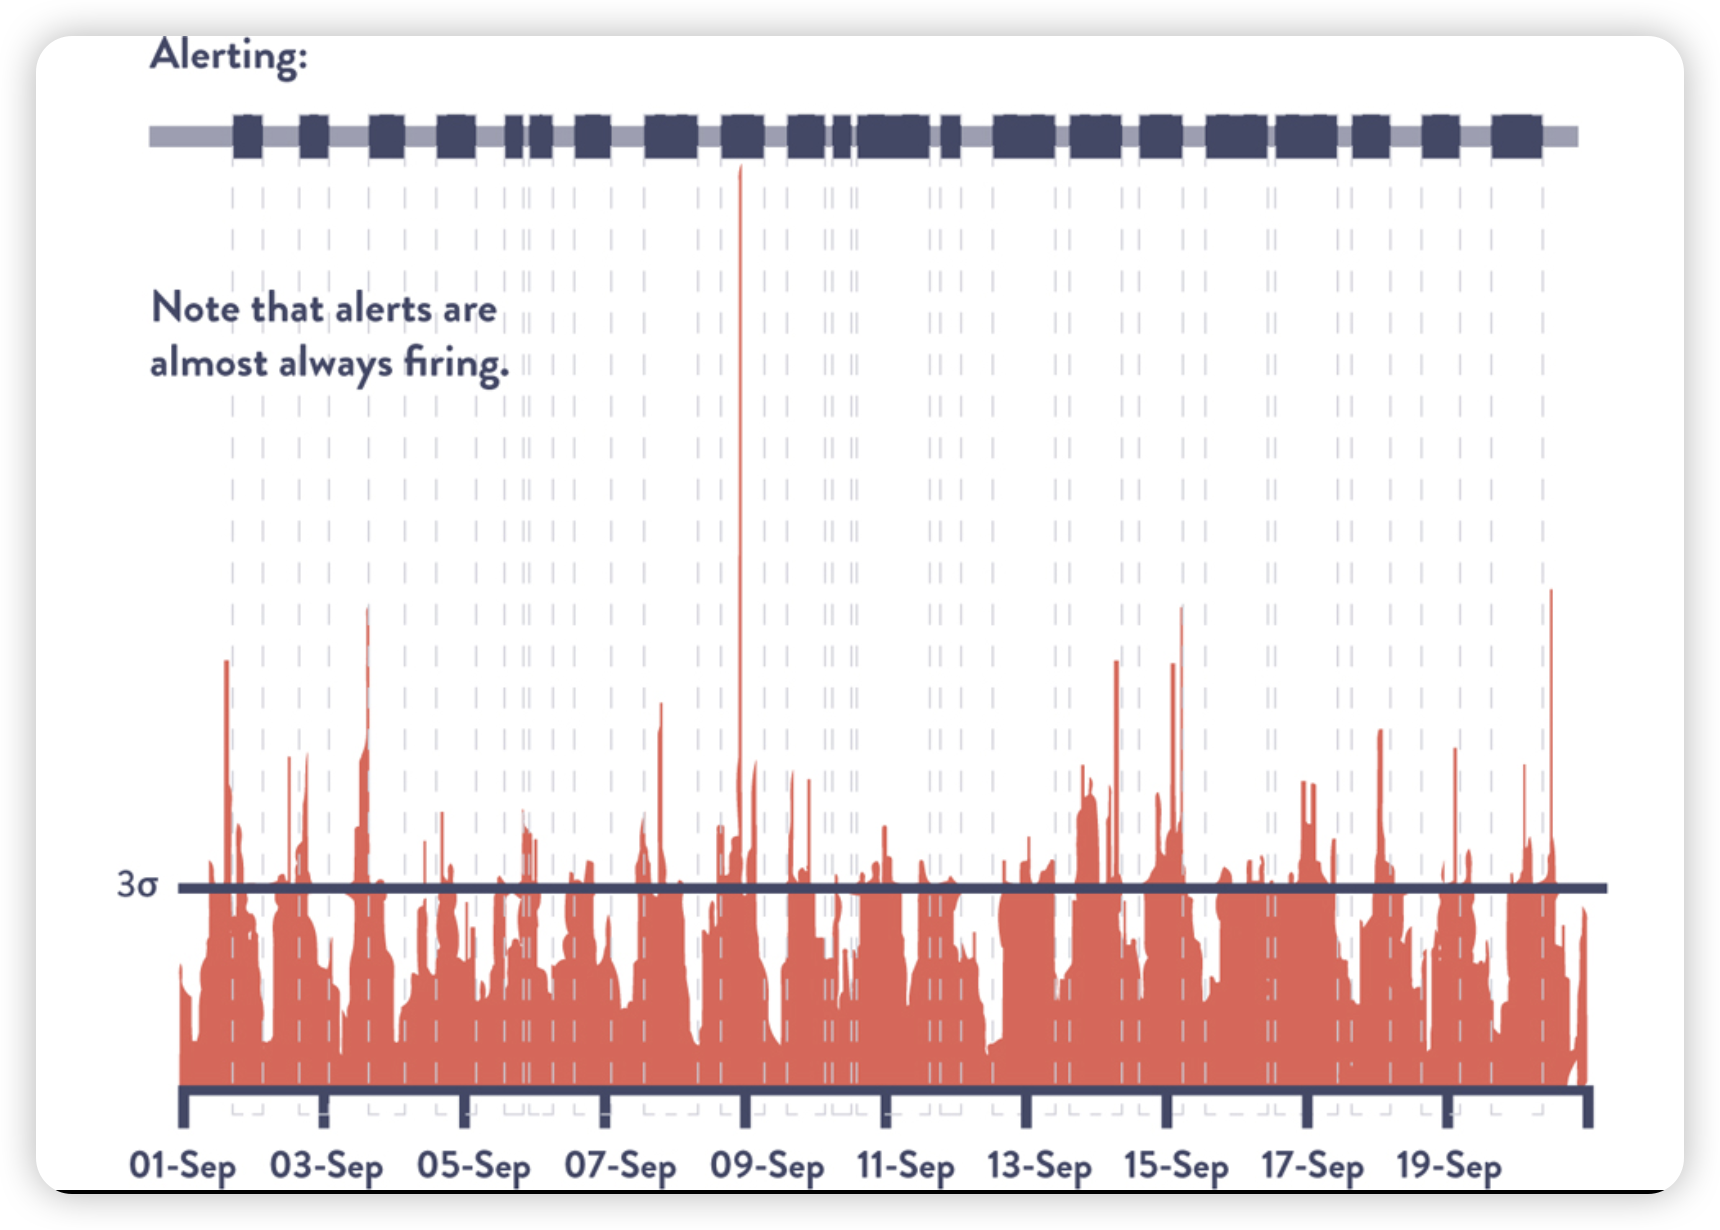
“In other words, when the distribution of the data set does not have the Gaussian shape described earlier, the properties associated with standard deviations do not apply. For example, consider the scenario in which we are monitoring the number of file downloads per minute from our website. We want to detect periods when we have unusually high numbers of downloads, such as when our download rate is greater than three standard deviations from our average, so that we can proactively add more capacity. Figure 15.2 shows our number of simultaneous downloads per minute over time, with a bar overlaid on top. When the bar is dark, the number of downloads within a given period (sometimes called a “sliding window”) is at least three standard deviations from the average. Otherwise, it is light.”
So basically not every distribution is Gaussian shape. Like this one will fire almost always.
 So what we do for other predictable pattern?
Anomaly Detection
So what we do for other predictable pattern?
Anomaly Detection
“Scryer addressed three problems with AAS. The first was dealing with rapid spikes in demand. Because AWS instance startup times could be ten to forty-five minutes, additional compute capacity was often delivered too late to deal with spikes in demand.”
“The second problem was that after outages, the rapid decrease in customer demand led to AAS removing too much compute capacity to handle future incoming demand. The third problem was that AAS didn’t factor in known usage traffic patterns when scheduling compute capacity.12
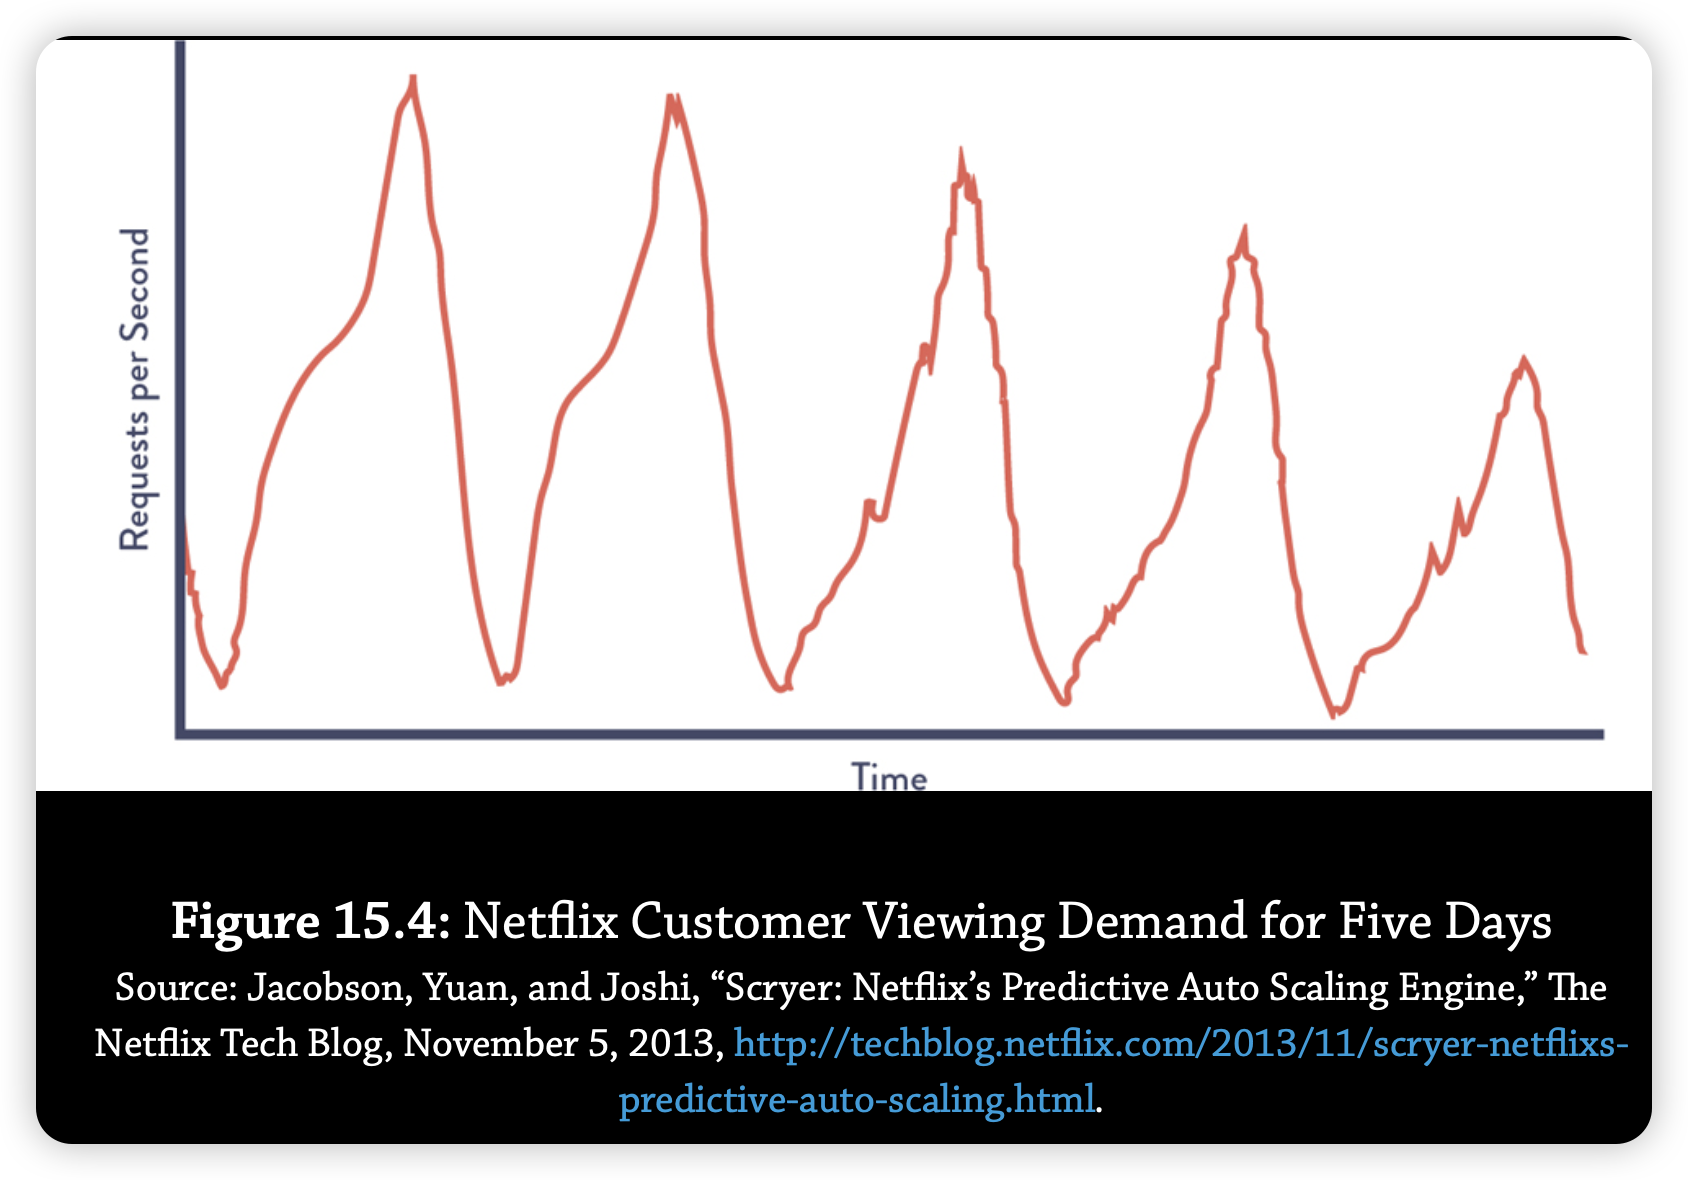
Netflix took advantage of the fact that their consumer viewing patterns were surprisingly consistent and predictable, despite not having Gaussian distributions. Figure 15.4 is a chart reflecting customer requests per second throughout the work week, showing regular and consistent customer viewing patterns Monday through Friday.13”
 计算机存浮点数